There are several critical indicators suggest here is a good opportunity for shorting:
Low risk sell opportunity on HSI weekly chart . (bear emotion exhausted)
ECRI recession call. (people will realize before year end)
VHSI at historically low level. (cheap option price)
China inverse dependency ratio reaches turning point. (Japan US relevence)
Wednesday, August 22, 2012


Bearish than ever on China
These charts below basically speaks for themselves
 |
| Add caption |
 |
| Japan,Us Inverse Dependency Ratio |
 |
| Spain,Greece,Portugal inverse population ratio |
 |
| China Inverse Dependency Ratio compare to US Japan |
 |
| Japan Inverse Dependency Ratio and property price |
|
| Us Inverse Dependency Ratio and property price |
 |
| China Inverse Dependency Ratio and property price |
source1 source2
Thursday, October 27, 2011
Copper Has Largest 5 Day Move Ever At Over 6 Standard Deviations
SOURCE:ZEROHEDGE.COM

As if the ES futures were not enough to satisfy the thirst of those seeking incredulities today, Copper - the oft-watched indicator of all that is good in the world for every Keynesian economist - has just smashed all previous records for its largest rise in a week. At over six standard deviations this is the biggest move ever and whether efficient market followers or Trichet stability hypothesis worshipers, this week's rip-fest must surely 'help' all those industrials in the world with their resource planning for the coming year/month/week/hour.

It's also worth noting that since Friday's close COMEX copper is up over 13% also alone.
Chart: Bloomberg
(hattip: Sean Corrigan)
Friday, October 7, 2011

Friday, September 16, 2011


Soybean Complex Chartology
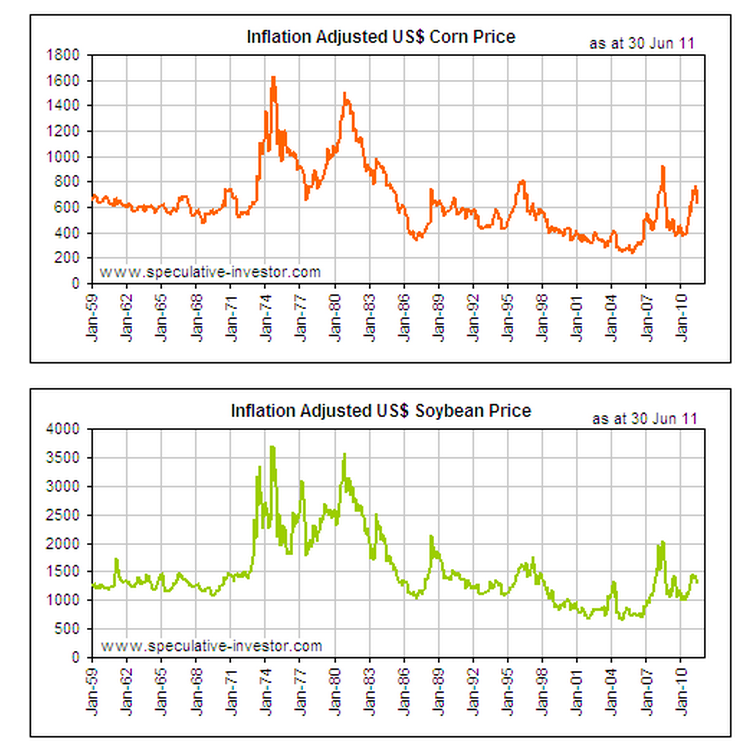 |
| Inflation-adjusted Soybean/corn Price |
 |
| Soybean-Corn ratio Soybean Implied volatility |
 |
| Soybean Price Presidential cycle Pre-election/election |
 |
| Cash Soybean Historical Price 1914-2011 |
 |
| Soybean Meal Historical Price |
Wednesday, August 17, 2011
Soybean price displays huge upside risk
Two months ago, I wrote an article arguing the reason why soybean price is way undervalued.
See http://riskhacker.blogspot.com/2011/06/why-soybean-price-could-double-from.html.
Today, I have a even more interesting chart for you. The seasonal presidential cycle soybean chart in the past 20 years. As we can see, the average price gains of soybean from august of pre-election year to March of election year is substantial.

See http://riskhacker.blogspot.com/2011/06/why-soybean-price-could-double-from.html.
Today, I have a even more interesting chart for you. The seasonal presidential cycle soybean chart in the past 20 years. As we can see, the average price gains of soybean from august of pre-election year to March of election year is substantial.

Subscribe to:
Posts (Atom)